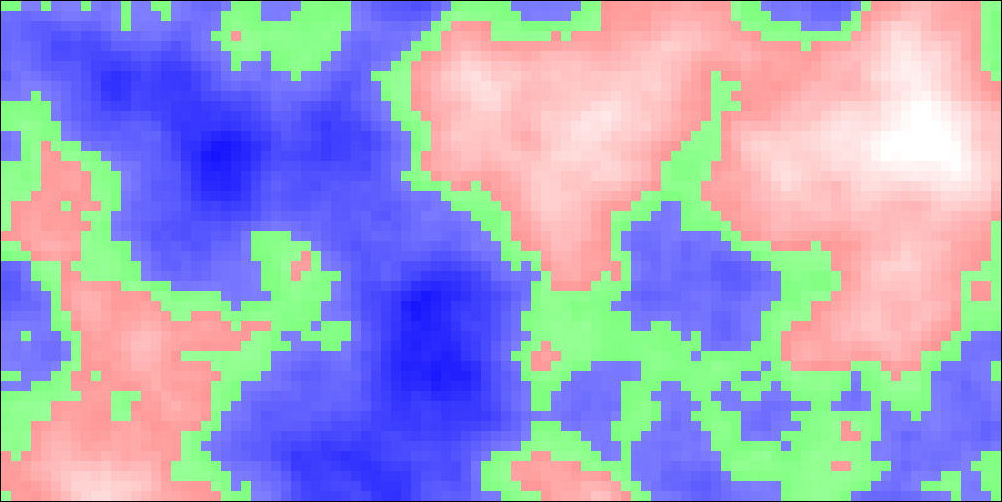
A while back, my brother told me about a guy in his class who was busy with a random map generator. I started to play around with the idea as well and I took a careful look at different Perlin libraries in order to come up with some random shapes. After coding around for a while, I ended up with some disappointing results. While Perlin allowed me to generate noise that wasn’t completely random, but in which each coordinate had some relation to the coordinates adjacent to it, the results were made little sense to me, despite them looking quite organic. I basically used the noise to determine elevation. Each negative value meant water, each positive value meant land. Using some simple math I could also assign different colours to different depths and altitudes. Looked kind of neat, but took an awful lot of processing power. I was playing around with this on a twelve hour flight from Amsterdam to San Francisco, and my little netbook felt like it would melt through my tray table.
What killed the performance was the sheer amount of data points to calculate and display. I rendered it in HTML, using DIVs, later using an SVG, but it really didn’t matter. The Perlin performance was poor and the amount of data points required to get anything fun was gigantic. I dropped the project for a few months, until I discovered a post on polygonal map generation written by Amit Patel and it really opened my eyes. The organic feel that I was trying to achieve using Perlin could also be achieved using a Voronoi diagram and the amount of actual datapoints would be much less. The relationships between bordering polygons was also built into the concept of the diagram and on top of that, the input needed was relatively small (depending on how many polygons you want to generate); just a bunch of coordinates for the polygon sites.
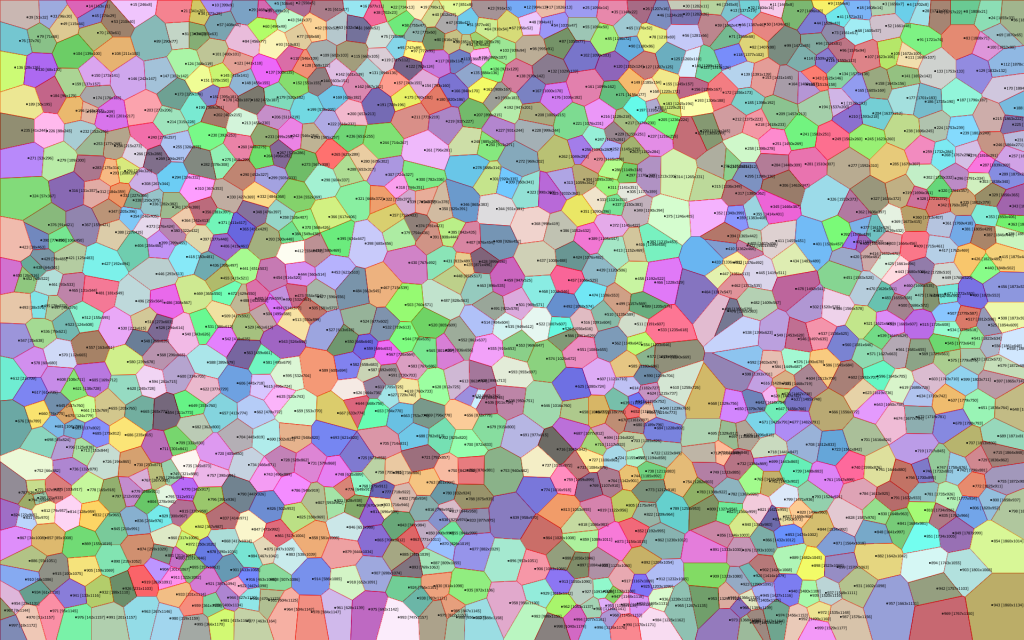
I found several libraries generating Voronoi diagrams, but the one PHP library that I found was a messy port of brilliant Javascript library done by Raymond Hill, who showed me the power of HTML5 and Javascript as a tool for data presentation! (For example; take a look at these mind boggling examples of data visualisation!) I ended up porting the Javascript library myself and creating raw PNG output. It took me a while to really figure out how all of it worked, but tonight I had somewhat of a breakthrough and I managed to solve some persistent bugs in my code. Below is an example of an 1920×1200 image with 1000 randomly generated polygon sites. One of the things to keep in mind is that the randomly generated points have been adjusted with two passes of the Lloyd relaxation to make the points a little more evenly spaced apart.
The next step will be to start figuring out land from water, assigning elevation and creating some sensible colours for the polygon cells. I’ll let my new best friend Amit Patel lead the way in logic; immitation, emulatio, creatio. I don’t quite understand all the logic behind everything yet, but if I take it one step at a time and tenaciously plug away, I’m sure that eventually my brain (made of obsidian, coated in teflon and impervious to the uptake of knowledge!) will eventually make this information his.


This is an incredible find for me, because I’m working along the same routes. Here’s my current status:
http://dl.dropbox.com/u/9638874/voronoi-test.jpg
But I’m running into trouble with the PHP library (I’m using the one you dumped). Care to share insights and code? I’d be very interested in your port.
Wow, that example looks great! You even have the biomes sorted already. Are you generating this in PHP? I’d be happy to give you my insights if it wasn’t for the fact that you seem to be much further along in your map generation process than I am!
I’m still struggling with the performance of the class, as I get a lot of time-outs due to things taking too long. Also, somewhere there’s a problem in closing one of the beach sections (either that or removing a circle event) because something I’m getting some really freaky polygon results.
I’d love to hear more about your project and how you got to your result because again, it looks great!